


Fisher-Perez's tests of statistical significance
Tests of significance are a statistical technology used for ascertaining the likelihood of empirical data, and, from there, for inferring a real effect, such as a correlation between variables or the effectiveness of a new treatment. Fisher, starting around 19252, standardized the interpretation of statistical significance and was the main driving force behind its popularity in empirical research, especially in the social and behavioral sciences. However, Fisher's tests are often carried out as a null hypothesis testing procedure, a pseudo-scientific procedure partly initiated by Fisher himself. I, thus, bring tests of significance up to a sounder scientific procedure in this article (or the Fisher-Perez's procedure).
In a nutshell, a test of significance works by establishing a theoretical distribution adequate to the data at hand, calculating the probability of the data under such distribution (p-values), contrasting the p-values against a pre-selected level of significance (eg, 5%), deciding whether the results are statistically significant or not, and inferring any research effects, as appropriate.
Interpreting a test of significance
A typical test of significance is based on two procedures. The probability of the data within a theoretical distribution is calculated first, then a decision is made regarding whether such probability is statistically significant or not. Both procedures are normally presented as a unique, seamless one, although this is not so.
The calculus of the probability of the data returns two statistics: a test statistic (eg, z, t, F…) and an associated probability (p, sig4).
- Most test statistics locate the observed data within a theoretical distribution, which also provides the null hypothesis for the test. However, the information derived from this statistic is of little immediate usability and, thus, can be ignored.
- The p-value, on the other hand, describes such location as a probability, which is the statistic ultimately used for deciding about statistical significance. The p-value may sometimes be expressed as an exact probability (eg, p=0.013), although it is most often expressed as a categorical probability (eg, p<0.05 and p<0.01, or as '*' and '**' in tables, respectively). It may sometimes be expressed as a nominal probability applicable to all tests in the research (eg, all p-values < 0.05)5.
An assessment of statistical significance is made upon p-values small enough that may be interpreted as a rare occurrence under the null hypothesis. Conventional levels of significance are 5% (0.05) and 1% (0.01), although the researcher may establish any other threshold considered appropriate to the research at hand. P-values larger than the threshold are considered non-significant and are typically ignored from further discussion. P-values equal to, or more extreme (smaller) than, the threshold are considered statistically significant, leading to an appropriate inference of real effects.
z=1.96, p=0.025 F=13.140, p<0.01 r=0.60* The test statistics are z (normality test), F (equality of variance test), and r (correlation)7. Each p-value indicates, with more or less precision, the probability of that statistic under their corresponding null hypothesis (conventionally, '*' stands for p≤0.05). Assuming a conventional level of significance (0.05, or 5%), all tests are, thus, statistically significant. The correlation statistic provides information which is usable directly7, being possible to infer a medium-to-high correlation between two variables. The test statistics 'z' and 'F' do not provide immediate useful information, and any inference about them require the calculation of descriptive statistics, such as skewness and kurtosis for inferring normality (z), and group means and variances for inferring group differences (F).
Conflicting notations
Tests of significance have evolved many misinterpretations, including conflicting notations. For example:
- P-values are often misinterpreted as "significance" statistics. For example, the statistical package SPSS reports p-values under the label 'sig', while some authors refer to p-values simply as 'significance'. However, as introduced earlier, the calculus of probabilities is a step independent from the interpretation of statistical significance, and proper labeling could help avoid current mix-ups. The solution proposed here is to reserve the notations of 'p' for p-values, and 'sig' for significance levels.
- P-values are further confused with the actual level of significance in a more insidious way. Indeed, most categorical and nominal uses of p-values are "forced to share", unbeknownst to the researcher, a dual role, so that, for example, p<0.05 is typically used both for indicating the probability of the results being smaller than 5% (p<0.05) and for interpreting the same results as being significant at the 5% conventional level (sig<0.05). The use of the reserved notations 'p' and 'sig' should help prevent such mix-up, as much as the use of exact levels of probabilities instead of categorical or nominal p-values.
- Finally, the significance level is also confused with a type I error (from Neyman-Pearson's procedure). Thus, it is often noted as 'alpha' (or 'α'). The use of the reserved notations 'sig' for significance and 'α' for type I error should help prevent such mix-up.
Scientific and pseudoscientific uses
Tests of significance are commonly misused in two accounts: they are used as a hypothesis testing procedure (instead of Bayes's), and they are mixed up with steps from a related procedure (Neyman-Pearson's) to form a seamless procedure for hypothesis testing. Such misuse leads to misinterpretations, by placing the interpretation of empirical results at the fringe between science and pseudoscience. Illustration 1 summarises how the procedure of tests of significance can be used either way with easy, thus care is needed in order to avoid using it in a pseudoscientific manner. Furthermore, being able to re-interpret a pseudoscientific interpretation into a scientific one is critical because pseudoscientific interpretations are commonplace and the publication record is rarely changed retroactively.
| Use | Scientific / Quasiscientific | Pseudoscientific |
|---|---|---|
| Test object | data [p(D|Ho)] | hypothesis [p(Ho|D)] |
| Null hypothesis | Cannot infer an effect | There is no effect |
| Alternative hypothesis | --- | There is an effect |
| Significance | p ≤ sig | p ≤ α (alpha) |
| Interpretation | p = probability of data | p = significance of data |
| ~ | sig = significant result | α = probability of Type I error |
| ~ | sig = infer an effect | α = reject Ho / accept Ha |
A main misuse of tests of significance is assuming they test null and alternative hypotheses. In reality, what they test is the probability of data under the null hypothesis (ie, assuming the null hypothesis is true). Given a significant result, it is possible to infer an effect different from the one expected under the null hypothesis, yet the hypothesis itself is never put to test.
Another misuse is to mix Fisher's procedure with Neyman-Pearson's procedure, as when setting alternative hypotheses, interpreting significance (and p-values) as the probability of making judgement errors (Type I errors), and rejecting null hypothesis or accepting alternative ones when results are statistically significant. In reality, Fisher's procedure only considers one hypothesis, the null hypothesis. An alternative hypothesis is unnecessary (it is not tested) and redundant (it simply is the negation of the null). And because no hypothesis is tested, they cannot be rejected or accepted, properly speaking. Furthermore, the level of significance cannot be interpreted as the probability of making a judgement error under Fisher's approach, even when it can be so interpreted under Neyman-Pearson's approach. Both procedures have different working parameters and, thus, shouldn't be mixed up.
The following results were taken from the highly respected 'Science' magazine. The authors of a particular article found that:
"…there was a significant correlation between mean bigram frequency and word accuracy [correlation coefficients (r) ranged from 0.51 for baboon VIO to 0.80 for baboon DAN, all P values < 0.05…]" (Grainger et al, published in Science 2012, p.248).In this commentary we can find a pseudoscientific use of tests of significance and the confusion highlighted earlier. The p-value has the dual role of being both a nominal p-value (all p-values are smaller than 0.05) as well as an indicator of the level of significance (all p<0.05 are considered significant at the conventional 5% level, sig<0.05). Results are thus taken to represent a true effect (accept Ha = real correlations) rather than being a statistical indicator from which to infer such true effect9.
In order to prevent a pseudoscientific conclusion, the same results should be understood as meaning: "the observed results had a chance of less than 5% of occurring under the null hypothesis (p<0.05)8, and we considered them to be statistically significant at a typical conventional level (sig<0.05). Therefore, we can infer the existence of a correlation between mean bigram frequency and word accuracy both for baboon VIO (r=0.51) and for baboon DAN (r=0.80)."
How to do a test of significance
A test of significance works by generating a theoretical distribution using the sample's statistics, if appropriate. Depending on the test statistic to be used, such distribution may be a Gaussian (normal) distribution, a t-distribution, an F-distribution, a binomial distribution, a Poisson distribution, a chi-squared distribution, etc. This distribution thus become the "null" distribution, providing both a 'null hypothesis' for the test and the space to locate the observed data and estimate their probability. Therefore, the resulting distribution is always the distribution of the null hypothesis and the location of the observed data in this distribution is simply a description of how probable the data are under the null hypothesis (ie, always assuming the null hypothesis is true).
If the location of the observed data (p-value) is extreme enough that it rarely occurs as random fluctuation under the null hypothesis, the data can be considered as statistically significant (ie, worthy of attention). If deemed statistically significant, then it can be inferred that the null hypothesis is not explanatory enough for that data and that another hypothesis, the so called 'alternative hypothesis' or 'research hypothesis', may provide the explanation sought.
 |
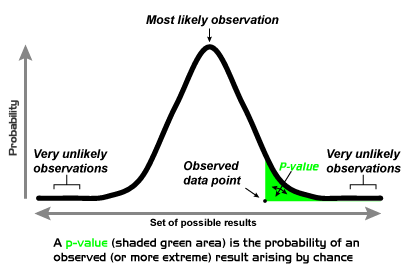 |
| A theoretical normal distribution (image embedded from Wikipedia on 21 April 2012) | Location of a p-value within a theoretical normal distribution (image embedded from Wikipedia on 21 April 2012) |
Procedure
The following procedure should be considered a compromise between a literal understanding of tests of significance and current pseudoscientific use. This compromise seems appropriate because of the high prevalence of the later case and the absence of the former, which could see research work and scientific articles rejected if straying too far off the current pseudoscientific understanding. Using this compromise, such research work may perhaps be interpreted as punctilious but not necessarily wrong. Meanwhile, researchers can progress further into an advanced use of literal tests of significance if so wished.
- Set up or assume a statistical null hypothesis (Ho). Setting up a null hypothesis helps clarify the aim of the research. However, such hypothesis can also be assumed, given that null hypotheses, in general, are nil hypothesis and can be easily 'reconstructed'. A null hypothesis is such that, for example, it will not be possible to infer any significant mean differences between groups, that it will not be possible to infer any significant correlation between variables, or that it will not be possible to infer any significant differences in variance between groups.
Ho: Given our sample results, we will be unable to infer a significant correlation between the dependent and independent research variables.
Ho: It will not be possible to infer any statistically significant mean differences between the treatment and the control groups.
Ho: We will not be able to infer that this variable's distribution significantly departs from normality.
- Decide on an appropriate level of significance for assessing results. Conventional levels are 5% (sig<0.05, or a similar result occurring under the null hypothesis less than 1 time in 20) or 1% (sig<0.01, or a similar result occurring under the null hypothesis less than 1 time in 100). However, the level of significance can be any 'threshold' the researcher considers appropriate for the intended research (thus, it could be 0.02, 0.001, 0.0001, etc). If required, label such level of significance as 'significance' or 'sig' (ie, sig<0.05); thus, avoid labeling it as 'p' (so not to confuse it with 'p-values') or as 'alpha' or 'α' (so not to confuse it with 'alpha' tolerance errors).
- Decide between a one-tailed or a two-tailed statistical test. A one-tailed test assesses whether the observed results are either significantly higher or smaller than the null hypothesis, but not both. Thus, one-tailed tests are appropriate when testing that results will only be higher or smaller than null results, or when the only interest is on interventions which will result in higher or smaller outputs. A two-tailed test, on the other hand, assesses both possibilities at once. It achieves so by dividing the total level of significance between both tails, which also implies that it is more difficult to get significant results than with a one-tailed test. Thus, two-tailed tests are appropriate when the direction of the results is not known, or when the researchers wants to check both possibilities in order to prevent making mistakes.
- Interpret results:
- Obtain and report the probability of the data (p). It is recommended to use the exact probability of the data, that is the 'p-value' (eg, p=0.011, or p=0.51). This exact probability is normally provided together with the pertinent statistic test (z, t, F…) either as 'p' or as 'sig' (significance)4. However, when necessary (eg, for reducing the size of a table), 'p-values' can also be reported in a categorical (eg, * for p<0.05, ** for p<0.01) or nominal manner (p<0.05)5.
- 'P-values' can be interpreted as the probability of getting the observed or more extreme results under the null hypothesis (eg, p=0.033 means that 3.3 times in 100, or 1 time in 33, we will obtain the same or a more extreme results as normal [or random] fluctuation under the null).
- 'P-values' are considered as statistically significant if they are equal or smaller than the chosen significance level. This is the actual test of significance as it interprets those 'p-values' falling beyond the threshold as 'rare' enough as to deserve attention.
- If results are accepted as statistically significant, it can be inferred that the null hypothesis is not explanatory enough for the observed data.
- Write up the report:
- All test statistics and associated exact 'p-values' can be reported as descriptive statistics, independently of whether they are statistically significant or not.
- When discussing the results and reaching conclusions, however, those results which are not statistically significant should be ignored. Significant results can be reported in different ways. Two "honest"6 ways of reporting are the following:
- As per Fisher (19593), significant results can be reported in the line of "Either an exceptionally rare chance has occurred, or the theory of random distribution is not true" (p.39). Eg, "In regards to this correlation, either a rare chance has occurred (p=0.01), or the hypothesis of nil correlation between these variables is not true."
- As per Conover (19801), significant results can be reported in the line of "Without the treatment I administered, experimental results as extreme as the ones I obtained would occur only about 3 times in 1000. Therefore, I conclude that my treatment has a definite effect" (p.2). Eg, "This correlation is so extreme that it would only occur about 1 time in 100 (p=0.01). Thus, it can be inferred that there is a significant correlation between these variables."
Discussion: As we obtained statistically significant results, we can infer a correlation between the dependent and independent research variables.
Discussion: Without the administered treatment, results as extreme as the ones I obtained would occur about 1 time in 100 (p=0.01). Thus, it can be inferred that the treatment does have a positive effect.
Discussion: Given our results, and unless an exceptionally rare chance has occurred (p=0.04), we can infer that this variable is not normal.
Want to know more?
- Neyman-Pearson's hypotheses testing
- This page deals with Neyman-Pearson's testing procedure, based on testing two competing hypotheses against each other.
Contributors to this page
Authors / Editors


| Other interesting sites |
 Knowledge |
 WikiofScience |
 AviationKnowledge |
 A4art |
 The Balanced Nutrition Index |


